HALL - CARPENTER, CO.
By Edwin T. Scallon, Copyright © 1990, 1995, 2008 All Rights Reserved
ACCIDENT RECONSTRUCTION AND BAC CALCULATION PROGRAMS
FRICTIONAL COEFFICIENT OF DRAG OR DRAG FACTOR
Probably the most important aspect in considering speed from skid marks is the relationship between the surface upon which the vehicle was traveling when entering a skid. In minimum speed, weight does not play any part in speed determination, since gravity affects all objects equally. Weight does become a factor when applying the conservation of linear momentum formula, which will be covered under its own topic area. However, the road surface and its accompanying roughness is to be considered in all motor vehicle accident reconstructions. It goes without saying, a person knows that ice is more slippery when sliding across it as opposed to trying to slide on an asphalt road surface. The "roughness" if you will can be calculated, this calculation is obtained using a "drag sled" or actually skidding a motor vehicle over the same surface at a known speed for a given distance.
Before we get to the mechanics of determining the drag factor for a given surface, knowledge of the theory of friction needs to be understood.
Friction is the force resisting the relative motion of solid surfaces, fluid layers, and material elements sliding against each other. There are several types of friction:
- Dry friction is a force that opposes the relative lateral motion of two solid surfaces in contact. Dry friction is subdivided into static friction ("stiction") between non-moving surfaces, and kinetic friction between moving surfaces. With the exception of atomic or molecular friction, dry friction generally arises from the interaction of surface features, known as asperities
- Fluid friction describes the friction between layers of a viscous fluid that are moving relative to each other.[3][4]
- Lubricated friction is a case of fluid friction where a lubricant fluid separates two solid surfaces.[5][6][7]
- Skin friction is a component of drag, the force resisting the motion of a fluid across the surface of a body.
- Internal friction is the force resisting motion between the elements making up a solid material while it undergoes deformation.[4]
When surfaces in contact move relative to each other, the friction between the two surfaces converts kinetic energy into thermal energy (that is, it converts work to heat). This property can have dramatic consequences, as illustrated by the use of friction created by rubbing pieces of wood together to start a fire. Kinetic energy is converted to thermal energy whenever motion with friction occurs, for example when a viscous fluid is stirred. Another important consequence of many types of friction can be wear, which may lead to performance degradation or damage to components. Friction is a component of the science of tribology.
Friction is desirable and important in supplying traction to facilitate motion on land. Most land vehicles rely on friction for acceleration, deceleration and changing direction. Sudden reductions in traction can cause loss of control and accidents.
Friction is not itself a fundamental force. Dry friction arises from a combination of inter-surface adhesion, surface roughness, surface deformation, and surface contamination. The complexity of these interactions makes the calculation of friction from first principles impractical and necessitates the use of empirical methods for analysis and the development of theory.
Friction is a non-conservative force - work done against friction is path dependent. In the presence of friction, some kinetic energy is always transformed to thermal energy, so mechanical energy is not conserved.
History
The Greeks, including Aristotle, Vitruvius, and Pliny the Elder, were interested in the cause and mitigation of friction.[8] They were aware of differences between static and kinetic friction with Themistius stating in 350 A.D. that "it is easier to further the motion of a moving body than to move a body at rest".[8][9][10][11]
The classic laws of sliding friction were discovered by Leonardo da Vinci in 1493, a pioneer in tribology, but the laws documented in his notebooks, were not published and remained unknown.[12][13][14][15][16][17] These laws were rediscovered by Guillaume Amontons in 1699[18] and became known as Amonton's three laws of dry friction (below). Amontons presented the nature of friction in terms of surface irregularities and the force required to raise the weight pressing the surfaces together. This view was further elaborated by Bernard Forest de Bélidor[19] and Leonhard Euler (1750), who derived the angle of repose of a weight on an inclined plane and first distinguished between static and kinetic friction.[20] John Theophilus Desaguliers (1734) first recognized the role of adhesion in friction.[21] Microscopic forces cause surfaces to stick together; he proposed that friction was the force necessary to tear the adhering surfaces apart.
The understanding of friction was further developed by Charles-Augustin de Coulomb (1785).[18] Coulomb investigated the influence of four main factors on friction: the nature of the materials in contact and their surface coatings; the extent of the surface area; the normal pressure (or load); and the length of time that the surfaces remained in contact (time of repose).[12] Coulomb further considered the influence of sliding velocity, temperature and humidity, in order to decide between the different explanations on the nature of friction that had been proposed. The distinction between static and dynamic friction is made in Coulomb's friction law (see below), although this distinction was already drawn by Johann Andreas von Segner in 1758.[12] The effect of the time of repose was explained by Pieter van Musschenbroek (1762) by considering the surfaces of fibrous materials, with fibers meshing together, which takes a finite time in which the friction increases.
John Leslie (1766–1832) noted a weakness in the views of Amontons and Coulomb: If friction arises from a weight being drawn up the inclined plane of successive asperities, why then isn't it balanced through descending the opposite slope? Leslie was equally skeptical about the role of adhesion proposed by Desaguliers, which should on the whole have the same tendency to accelerate as to retard the motion.[12] In Leslie's view, friction should be seen as a time-dependent process of flattening, pressing down asperities, which creates new obstacles in what were cavities before.
Arthur Jules Morin (1833) developed the concept of sliding versus rolling friction. Osborne Reynolds (1866) derived the equation of viscous flow. This completed the classic empirical model of friction (static, kinetic, and fluid) commonly used today in engineering.[13] In 1877, Fleeming Jenkin and J. A. Ewing investigated the continuity between static and kinetic friction.[22]
The focus of research during the 20th century has been to understand the physical mechanisms behind friction. Frank Philip Bowden and David Tabor (1950) showed that, at a microscopic level, the actual area of contact between surfaces is a very small fraction of the apparent area.[14] This actual area of contact, caused by asperities increases with pressure. The development of the atomic force microscope (ca. 1986) enabled scientists to study friction at the atomic scale,[13] showing that, on that scale, dry friction is the product of the inter-surface shear stress and the contact area. These two discoveries explain Amonton's first law (below); the macroscopic proportionality between normal force and static frictional force between dry surfaces. L.A. Sosnovskiy, S.S. Sherbakov and V.V. Komissarov showed [23] that the friction force is proportional to both the contact and the volumetric (tensile-compression, bending, torsion, etc.) load, if the volumetric load causes cyclic stresses (±σ) in the contact area.
Laws of dry friction
The elementary property of sliding (kinetic) friction were discovered by experiment in the 15th to 18th centuries and were expressed as three empirical laws:
- Amontons' First Law: The force of friction is directly proportional to the applied load.
- Amontons' Second Law: The force of friction is independent of the apparent area of contact.
- Coulomb's Law of Friction: Kinetic friction is independent of the sliding velocity.
Coefficient of friction
The coefficient of friction (COF), often symbolized by the Greek letter µ, is a dimensionless scalar value which describes the ratio of the force of friction between two bodies and the force pressing them together. The coefficient of friction depends on the materials used; for example, ice on steel has a low coefficient of friction, while rubber on pavement has a high coefficient of friction. Coefficients of friction range from near zero to greater than one. It is an axiom of the nature of friction between metal surfaces that it is greater between two surfaces of similar metals than between two surfaces of different metals— hence, brass will have a higher coefficient of friction when moved against brass, but less if moved against steel or aluminum.
For surfaces at rest relative to each other {\displaystyle \mu =\mu _{\mathrm {s} }\,}, where {\displaystyle \mu _{\mathrm {s} }\,} is the coefficient of static friction. This is usually larger than its kinetic counterpart. The coefficient of static friction exhibited by a pair of contacting surfaces depends upon the combined effects of material deformation characteristics and surface roughness, both of which have their origins in the chemical bonding between atoms in each of the bulk materials and between the material surfaces and any adsorbed material. The fractality of surfaces, a parameter describing the scaling behavior of surface asperities, is known to play an important role in determining the magnitude of the static friction.
 , where {\displaystyle \mu _{\mathrm {s} }\,}
 is the coefficient of static friction. This is usually larger than its kinetic counterpart. The coefficient of static friction exhibited by a pair of contacting surfaces depends upon the combined effects of material deformation characteristics and
 For surfaces in relative motion {\displaystyle \mu =\mu _{\mathrm {k} }\,}, where {\displaystyle \mu _{\mathrm {k} }\,} is the coefficient of kinetic friction. The Coulomb friction is equal to {\displaystyle F_{\mathrm {f} }\,}, and the frictional force on each surface is exerted in the direction opposite to its motion relative to the other surface.
 , where {\displaystyle \mu _{\mathrm {k} }\,}
 is the coefficient of kinetic friction. The Coulomb friction is equal to {\displaystyle F_{\mathrm {f} }\,}
 , and the frictional force on each surface is exerted in the direction opposite to its motion relative to the other surface.
Arthur Morin introduced the term and demonstrated the utility of the coefficient of friction. The coefficient of friction is an empirical measurement – it has to be measured experimentally, and cannot be found through calculations. Rougher surfaces tend to have higher effective values. Both static and kinetic coefficients of friction depend on the pair of surfaces in contact; for a given pair of surfaces, the coefficient of static friction is usually larger than that of kinetic friction; in some sets the two coefficients are equal, such as teflon-on-teflon.
Most dry materials in combination have friction coefficient values between 0.3 and 0.6. Values outside this range are rarer, but teflon, for example, can have a coefficient as low as 0.04. A value of zero would mean no friction at all, an elusive property. Rubber in contact with other surfaces can yield friction coefficients from 1 to 2. Occasionally it is maintained that µ is always < 1, but this is not true. While in most relevant applications µ < 1, a value above 1 merely implies that the force required to slide an object along the surface is greater than the normal force of the surface on the object. For example, silicone rubber or acrylic rubber-coated surfaces have a coefficient of friction that can be substantially larger than 1.
While it is often stated that the COF is a "material property," it is better categorized as a "system property." Unlike true material properties (such as conductivity, dielectric constant, yield strength), the COF for any two materials depends on system variables like temperature, velocity, atmosphere and also what are now popularly described as aging and deaging times; as well as on geometric properties of the interface between the materials, namely surface structure.[1] For example, a copper pin sliding against a thick copper plate can have a COF that varies from 0.6 at low speeds (metal sliding against metal) to below 0.2 at high speeds when the copper surface begins to melt due to frictional heating. The latter speed, of course, does not determine the COF uniquely; if the pin diameter is increased so that the frictional heating is removed rapidly, the temperature drops, the pin remains solid and the COF rises to that of a 'low speed' test.
![]()
The f is the measurement of force (the coefficient of friction), the F is the force of gravity coming down on the tires, and W is the weight of the tire. In order to find the force of gravity (sometimes referred to as the drag factor), specialists actually drag one of the weighed tires along the roadway to determine the force. They will drag the tire maybe twenty times and take the average force measurement. To actually find the measurement of the drag factor requires a number of complex formulas and some special equipment.In order to use this formula for measuring skid marks, the skids have to be in straight lines.
Sometimes, vehicles will skid in a circular motion. These marks are called yaw marks. Yaw marks occur when tires rotate and spin. In order to find the speed the vehicle was traveling before it started to skid, accident re-constructionists use another formula which will be covered in the section identified as Critical Speed. however, even determining the critical speed of the centrifugal yaw marks drag factor still has to be determined.
A picture of a commercially available drag sled is shown below:

In practice the following photos will demonstrate the use of this devise under actual conditions:
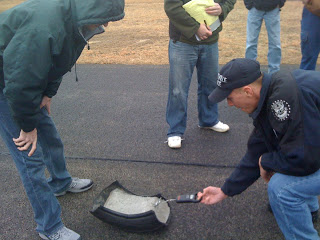

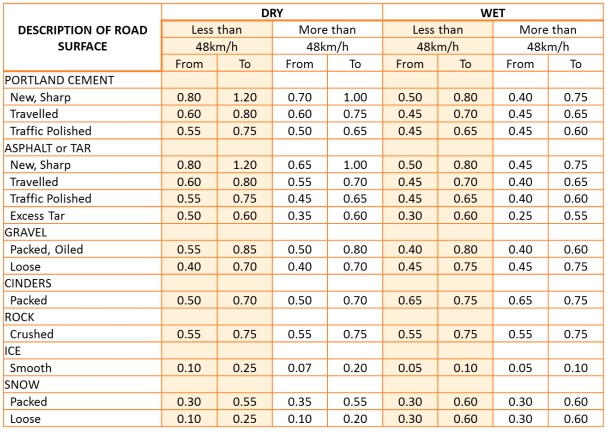
When pulling the drag sled, pull it in the direction of the skid and the sled should be pulled with the connecting scale parallel to the road surface. By utalizing the drag sled, no need to compensate for the road grade. If on the other hand you utilize a drag factor chart for the surface of the skid, one must then measure the grade of the road when using the minimum speed or critical speed formulas. Below is a chart that is customarily used in the industry if the surface is too dangerous to actually meassure, such as Rt. 95 South in the high speed lane.
To calculate the road grade, you must have a 2 Ft. carpenter's level and a ruler. You would place the ruler perpendicular to the road surface and then raise the end of the level up until the air bubble in the site glass is centered. Record the number of inches the bottom of the level reaches on the ruler. Then use the following formula to calculate the road grade.
m= (pwercent of grade) = h/D
where h = height of rise or fall of road and D= Distance which is always 100
hence, m=Rise/Run
The percent of grade equals the rise or fall of the road per 100 feet. In this formula inches are divided by 12. Therefore 1inch = .08 2inches = .16 etc. This is to be added to your speed formula if you use the above chart. DO NOT calculate the speed if using a test vehicle or a drag sled, since the road grade is present during your tests.
Now applying what we know about drag factor, let's assume you are testing a drag factor on a ten year old well traveled asphalt rural road. You would place the drag sled next to the skid marks and attach the scale using a lanyard constructed from a rope or short length of light chain. You would then pull the drag sled in the direction of the skid, keeping the scale parallel with the road surface and record the amount of force in pounds it takes to pull the sled for a significant distance (aproximately 6 feet). After recording the force indicated on the scale, pick up the sled with the scale and hold it aloft. Record the weight of the drag sled.
Now you can plug in the values. For our example, let's assume that it took 8pounds of force to pull the drag sled and the sled weighs 10pounds, Using the formula:
f = F/W
Where f is the drag factor of the road surface. Fis the force needed to pull the drag sled. W is the weight of the drag sled so we see the following"
f = 8/10
f= 0.8g
This rural road had an above average drag factor. Normally using the above chart we find the range for a traveled road such as a rural road normally is, between 0.6 and 0.8 and it has been my experience that most roads of this type usually have a drag factor in the area of 0.7 - 0.75.